Microvolume spectrophotometers are designed to measure the absorbance of light by biological samples, such as DNA, RNA, and proteins, using as little as 1-2 microliters. Efficient biological sample analysis with microvolume spectrophotometers involves understanding the technology, following proper techniques, and applying the results for accurate and reproducible data.
Understanding the Basics of Microvolume Spectrophotometry
Microvolume spectrophotometers work on the principle of measuring the absorbance of light by molecules in a sample. Different biological molecules absorb light at specific wavelengths, allowing for quantification based on the absorbance data.
For example:
- DNA and RNA absorb light at 260 nm.
- Proteins typically absorb light at 280 nm.
- Other molecules, such as contaminants or dyes, have their own characteristic absorbance wavelengths.
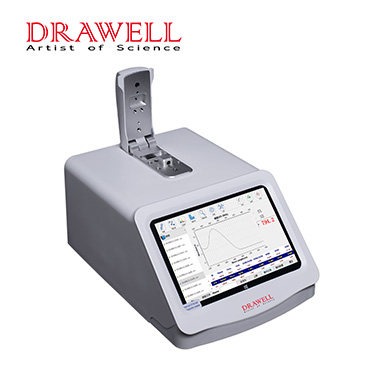
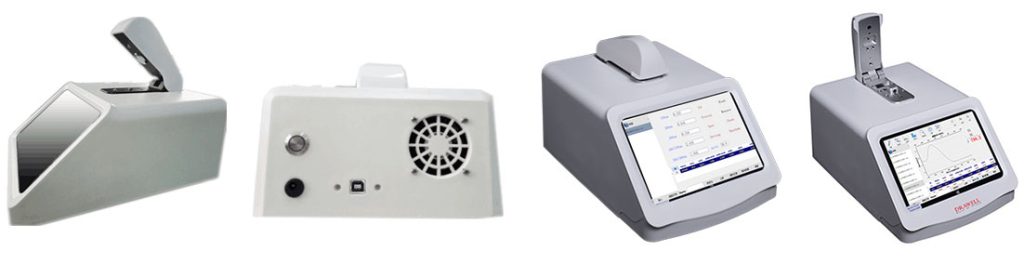
Micro spectrophotometers eliminate the need for cuvettes by directly pipetting the small sample onto a specialized measurement surface. This reduces waste and the potential for contamination, making it an ideal choice for limited or precious samples.
Key Features of Microvolume Spectrophotometers for Efficient Biological Sample Analysis
- Small Sample Volume: As little as 1-2 microliters of sample are needed, preserving valuable biological material.
- Quick Measurement: Measurements typically take only a few seconds, providing rapid results.
- Broad Wavelength Range: These devices often cover a wide wavelength range (e.g., 190–840 nm), allowing analysis of various biomolecules.
- High Sensitivity and Accuracy: Microvolume spectrophotometers offer high sensitivity, capable of detecting low concentrations of nucleic acids or proteins.
- Easy Calibration: Automatic calibration with built-in standards minimizes user error.
Step-by-Step Guide to Efficient Use Microvolume Spectrophotometers
To achieve accurate and efficient biological sample analysis using micro-volume spectrophotometers, follow these steps:
1. Sample Preparation
- Ensure Purity: Remove contaminants from your sample, such as salts, proteins, or organic compounds, to avoid interference with absorbance readings.
- Mix Thoroughly: Homogenize the sample to ensure even distribution of molecules for consistent readings.
2. Instrument Calibration
- Use a Blank: Before measuring samples, calibrate the spectrophotometer using a blank solution, typically water or the same buffer your sample is dissolved in. This ensures an accurate baseline.
- Check Settings: Ensure that the device is set to measure at the appropriate wavelengths based on the sample type (e.g., 260 nm for nucleic acids, 280 nm for proteins).
3. Loading the Sample
- Accurate Pipetting: Use a pipette to place a small volume (1-2 microliters) of the sample directly onto the instrument’s measurement surface or pedestal.
- Avoid Air Bubbles: Bubbles can distort readings. Pipette slowly and steadily to minimize this risk.
- Wipe the Pipette Tip: To avoid excess liquid clinging to the pipette tip, wipe it gently before applying the sample.
4. Measuring the Sample
- Initiate the Measurement: Once the sample is loaded, start the measurement process. The spectrophotometer will capture the absorbance at the desired wavelengths, typically providing results within seconds.
- Check the Results: Confirm that the measurement data, including absorbance values or concentration, matches your expectations based on the sample type and preparation.
5. Cleaning the Instrument
- Clean After Each Use: After each sample measurement, clean the pedestal or measurement surface with a lint-free tissue and a solvent like water or alcohol to prevent cross-contamination.
- Inspect the Surface: Ensure no residue is left behind that could affect subsequent measurements.
6. Repeating for Multiple Samples
- Recalibrate if Needed: If you’re measuring a large number of samples, recalibrate the instrument periodically to maintain accuracy.
- Maintain Consistency: Use the same pipetting technique and cleaning procedure for every sample to ensure consistency across measurements.
7. Interpreting the Results
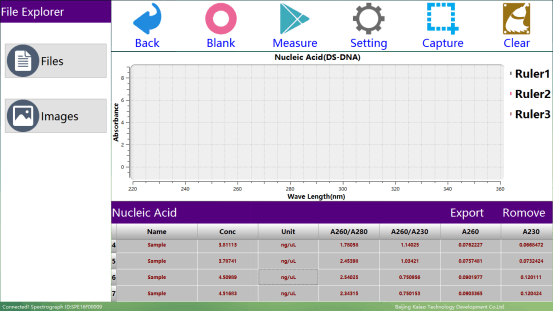
Results from microvolume spectrophotometers are typically displayed as absorbance values or concentration readings. Efficient biological sample analysis depends on correctly interpreting these results.
- Nucleic Acid Purity: For DNA or RNA samples, assess purity using the A260/A280 ratio. A ratio of around 1.8 indicates pure DNA, while a ratio around 2.0 is typical for RNA. Lower values may indicate protein contamination.
- Concentration Determination: The instrument will often calculate sample concentration based on absorbance readings and preset factors (such as extinction coefficients for DNA or proteins). Double-check the concentration results to ensure they match expected ranges for your experiment.
- Contaminant Detection: If analyzing protein samples, the A260/A280 ratio can indicate nucleic acid contamination. Similarly, for nucleic acids, an A260/A230 ratio is used to check for organic compounds or salts, with values above 2.0 considered ideal.
8. Best Practices for Accuracy
To maximize efficiency and reliability when using microvolume spectrophotometers for biological sample analysis, consider the following best practices:
- Use Consistent Pipetting Techniques: Accurate pipetting ensures uniform sample volumes and reduces measurement variability.
- Clean Regularly: Regular cleaning of the sample pedestal between measurements avoids contamination.
- Monitor Calibration: Frequently calibrate the device with a blank to maintain accuracy throughout your analysis session.
- Document Results: Keep detailed records of sample measurements, including absorbance data, purity ratios, and concentration values, for future reference or replication.
Applications of Microvolume Spectrophotometers in Biological Research
This chart outlines the main uses of microvolume spectrophotometers in biological research, highlighting their versatility across different fields of study.
| Application | Purpose | Key Measured Parameters | Common Samples |
| Nucleic Acid Quantification | Measuring the concentration and purity of DNA and RNA | Absorbance at 260 nm; A260/A280 ratio | DNA, RNA |
| Protein Quantification | Determining the concentration of proteins in solution | Absorbance at 280 nm; Protein extinction coefficient | Proteins (e.g., antibodies, enzymes) |
| Label-Free Quantification | Assessing the concentration of biomolecules without fluorescent or radioactive labels | Absorbance at various wavelengths | Peptides, oligonucleotides |
| Contamination Detection | Detecting the presence of impurities such as salts or organic compounds | A260/A230 ratio | DNA, RNA, proteins |
| Enzyme Kinetics | Measuring enzyme activity by tracking absorbance changes over time | Absorbance at multiple wavelengths | Enzymes, substrates |
| Pathogen Detection | Quantifying nucleic acids in pathogen detection assays | Absorbance at 260 nm | Viral RNA, bacterial DNA |
| Oligonucleotide Purity Assessment | Determining the purity and concentration of synthesized oligonucleotides for molecular biology applications | Absorbance at 260 nm; A260/A280 ratio | Oligonucleotides (for PCR, sequencing) |
| Microarray Spot Quantification | Quantifying the amount of nucleic acids or proteins spotted on microarrays | Absorbance in UV and visible ranges | Nucleic acids, proteins |
| Cellular Metabolite Measurement | Analyzing the concentration of cellular metabolites in biochemical pathways | Absorbance at various wavelengths | Metabolites, culture supernatants |
| Nanoparticle Characterization | Measuring the concentration and absorbance spectrum of nanoparticles used in biological applications | Absorbance across UV and visible spectra | Nanoparticles |
To sum up, microvolume spectrophotometers offer a fast, accurate and efficient solution for biological sample analysis, particularly when sample volume is limited. Following best practices in sample handling and using the features of the micro spectrophotometer effectively, researchers can obtain reliable data for a wide range of biological studies.