
Formaldehyde, a ubiquitous chemical compound, finds applications in various industries, from resin production to medical sterilization. However, its toxicity and potential health hazards necessitate stringent monitoring and analysis. Gas Chromatography (GC) and High-Performance Liquid Chromatography (HPLC) are two widely adopted methods for formaldehyde analysis. Each technique has unique principles, technical features, and application scenarios that make them suitable for specific contexts. This article provides an in-depth comparison of GC and HPLC in formaldehyde analysis, helping readers make informed decisions based on their analytical needs.
Core Principle Comparison
The analysis of formaldehyde using Gas Chromatography (GC) and High-Performance Liquid Chromatography (HPLC) is based on distinct principles tailored to the physical and chemical properties of the analyte.
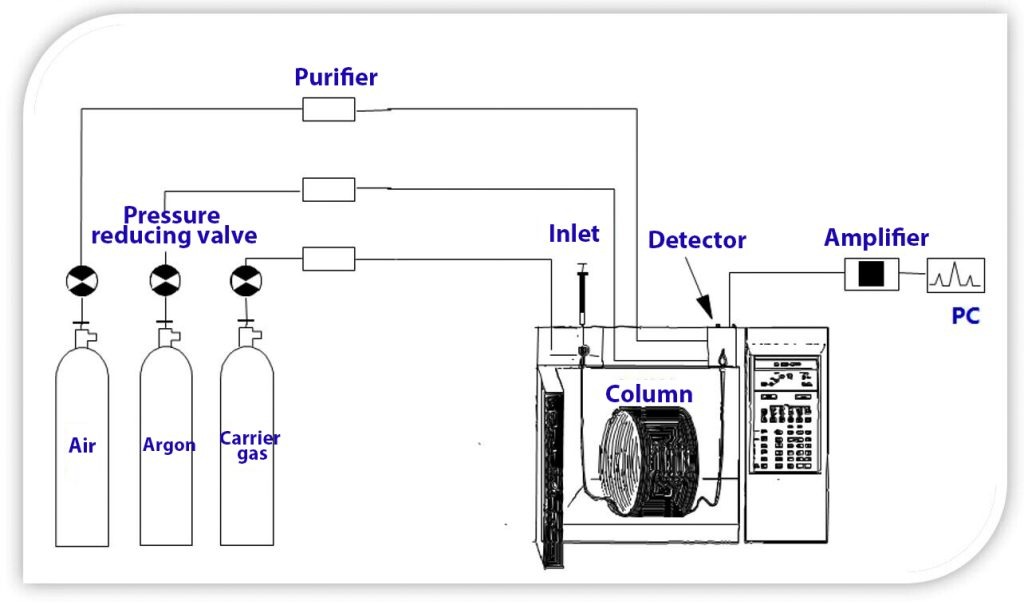
GC relies on the separation of volatile compounds in the gas phase, which often necessitates derivatization of formaldehyde to enhance volatility. A carrier gas transports the sample through a stationary phase column, where components are separated based on their boiling points and interactions with the column material. Detection is achieved using methods like flame ionization detection (FID) or mass spectrometry (MS), offering high sensitivity for volatile analytes.
In contrast, HPLC separates compounds in a liquid mobile phase based on polarity and solubility. Formaldehyde is commonly derivatized using reagents like DNPH to form UV- or fluorescence-detectable derivatives. The separation occurs in a stationary-phase-packed column (e.g., C18), making HPLC suitable for less volatile or thermally unstable analytes.
Key parameters such as separation principle, detection methods, and derivatization differentiate GC and HPLC, as summarized below:
| Parameter | Gas Chromatography (GC) | High-Performance Liquid Chromatography (HPLC) |
| Separation Principle | Volatility and gas-phase partitioning | Liquid-phase partitioning or adsorption, often after derivatization |
| Mobile Phase | Inert gas (e.g., helium, nitrogen, hydrogen) | Liquid solvent (e.g., water, methanol, acetonitrile) |
| Stationary Phase | Solid or liquid coated on a solid support | Solid or liquid bonded to a solid support, often in a packed column |
| Sample State | Gaseous or vaporized liquid/solid | Liquid solution |
| Detection Methods | FID, MS | UV, Fluorescence |
| Analyte Property | Volatility | Solubility and interaction with stationary/mobile phases, often enhanced through derivatization. |
| Derivatization | Generally not required, but sometimes used for sensitivity. | Often required to enhance detectability and stability of formaldehyde. |
| Separation Efficiency | Dependent on boiling point and stationary phase interaction. | Dependent on analyte interactions with stationary and mobile phases. |
In essence, GC leverages volatility for separation, while HPLC relies on differential interactions in a liquid environment. This fundamental difference dictates the sample preparation requirements and the types of matrices suitable for each technique
Technical Feature Differences
Gas Chromatography (GC) and High-Performance Liquid Chromatography (HPLC) differ significantly in their technical features, which influences their suitability for specific applications.
Sensitivity and Detection Limit:
GC, particularly when coupled with mass spectrometry (GC-MS), offers high sensitivity and low detection limits, often in the parts-per-billion (ppb) range. This makes it ideal for trace-level detection of volatile formaldehyde.
HPLC, while also capable of achieving low detection limits, typically operates at slightly higher thresholds (e.g., parts-per-million or low ppb levels) depending on the detector used.
Sample Processing Complexity:
GC requires derivatization of formaldehyde to increase its volatility, which can add complexity and time to sample preparation. The derivatization process must be precise to ensure accurate quantification.
HPLC also requires derivatization for formaldehyde detection but is generally more straightforward, especially when handling aqueous or biological samples that are not compatible with GC.
Instrumentation and Cost:
GC systems are typically more cost-effective for routine analysis but require high-purity carrier gases. HPLC systems, while more versatile, have higher operational costs due to solvent use and column replacement.
Throughput and Efficiency:
HPLC tends to handle complex mixtures faster, whereas GC might require longer run times for optimal separatio
Adaptability to Sample Types:
GC is highly effective for volatile and gaseous samples, such as air quality monitoring, but less suitable for aqueous or thermally unstable samples without additional preparation. HPLC, on the other hand, is highly adaptable to a wide range of sample matrices, including biological, pharmaceutical, and environmental samples.
A comparison of the adaptability of the two methods is presented in the table below:
| Sample Type | Gas Chromatography (GC) | High-Performance Liquid Chromatography (HPLC) |
| Air/Gases | Excellent (direct injection or sorbent tube sampling). | Limited (requires sample pre-treatment, like impinger collection). |
| Water/Aqueous Solutions | Limited (requires headspace or extraction). | Excellent (direct injection or derivatization). |
| Solid Matrices | Possible (requires thermal desorption or solvent extraction). | Possible (requires extraction and derivatization). |
| Biological Fluids | Possible (requires headspace or extraction). | Excellent (requires extraction and derivatization). |
| Food Products | Possible (requires headspace or extraction). | Excellent (requires extraction and derivatization). |
| Industrial Emissions | Excellent (direct sampling). | Limited (Requires impinger collection) |
Application Scenario Selection
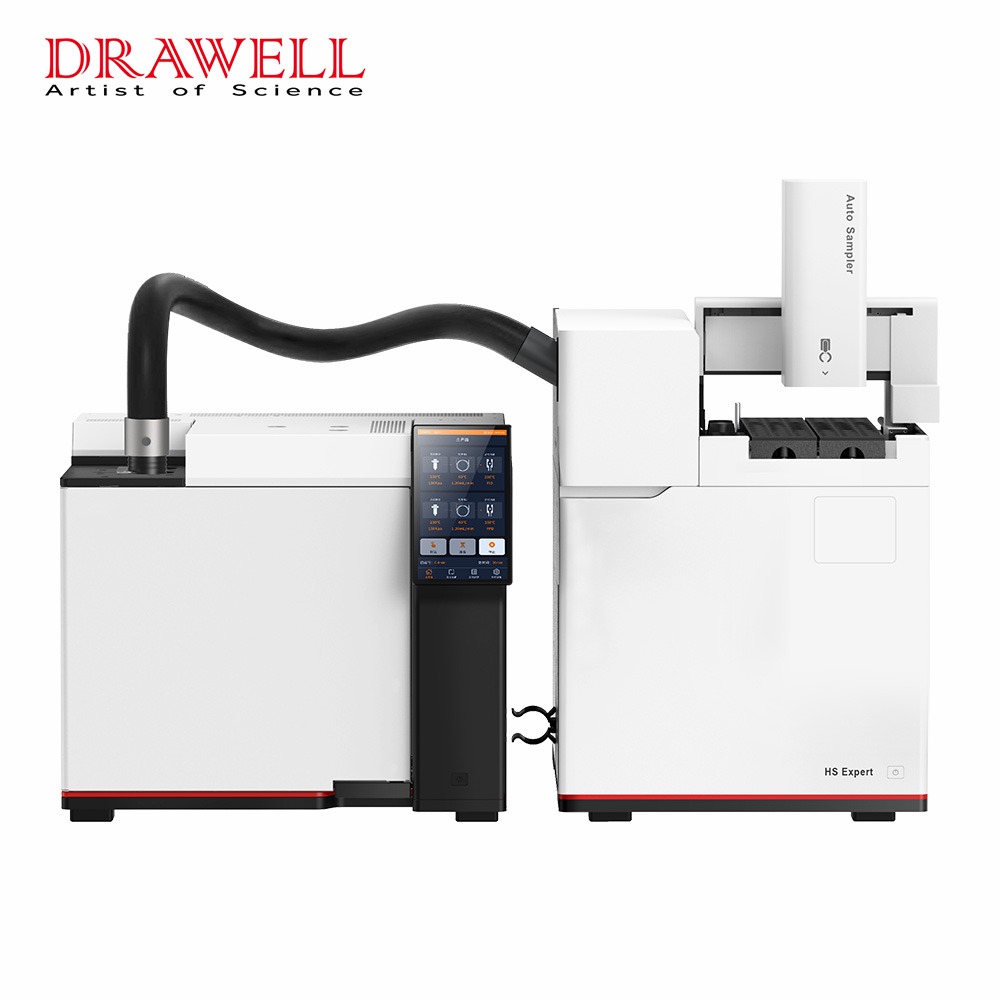
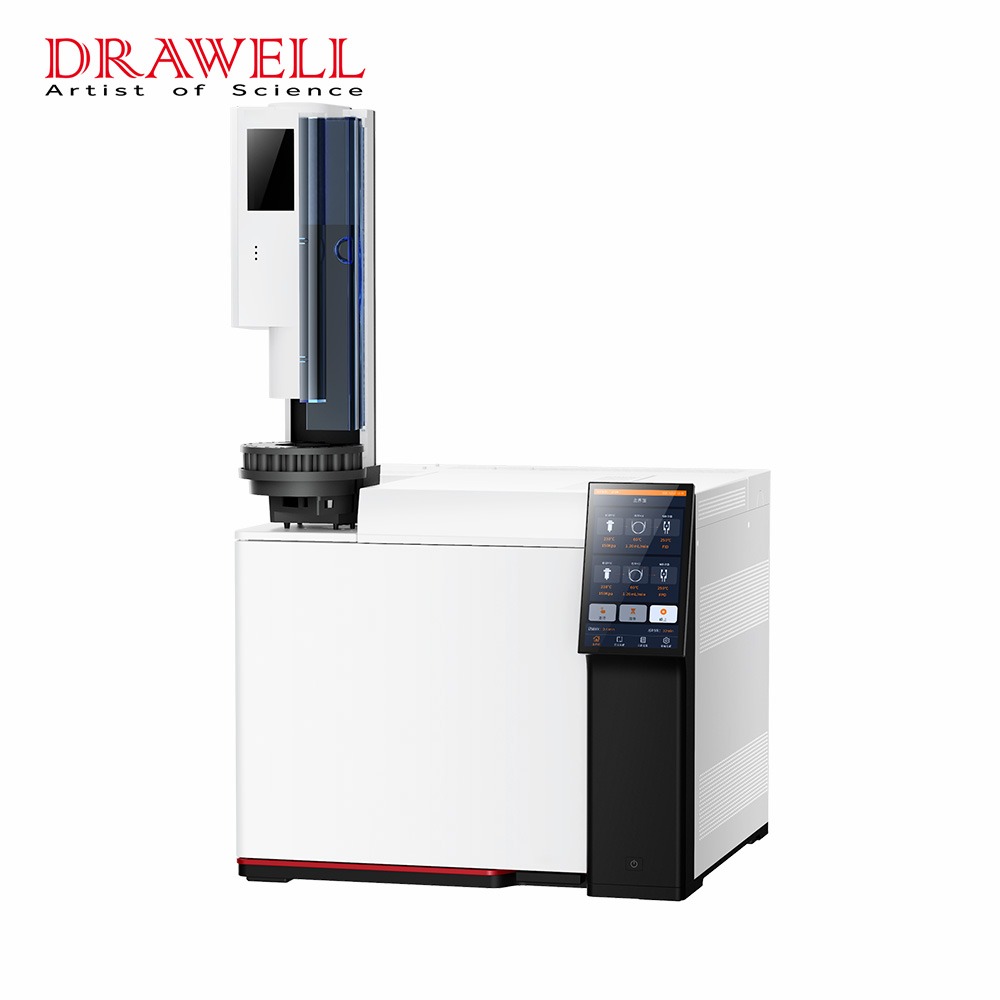
Advantageous Scenarios of GC
Ideal for analyzing formaldehyde in air samples, gaseous emissions, and volatile organic compound (VOC) mixtures.
Applications include environmental monitoring, industrial hygiene, and indoor air quality assessment. For example, monitoring formaldehyde emissions from wood-based panel manufacturing plants using GC-FID.
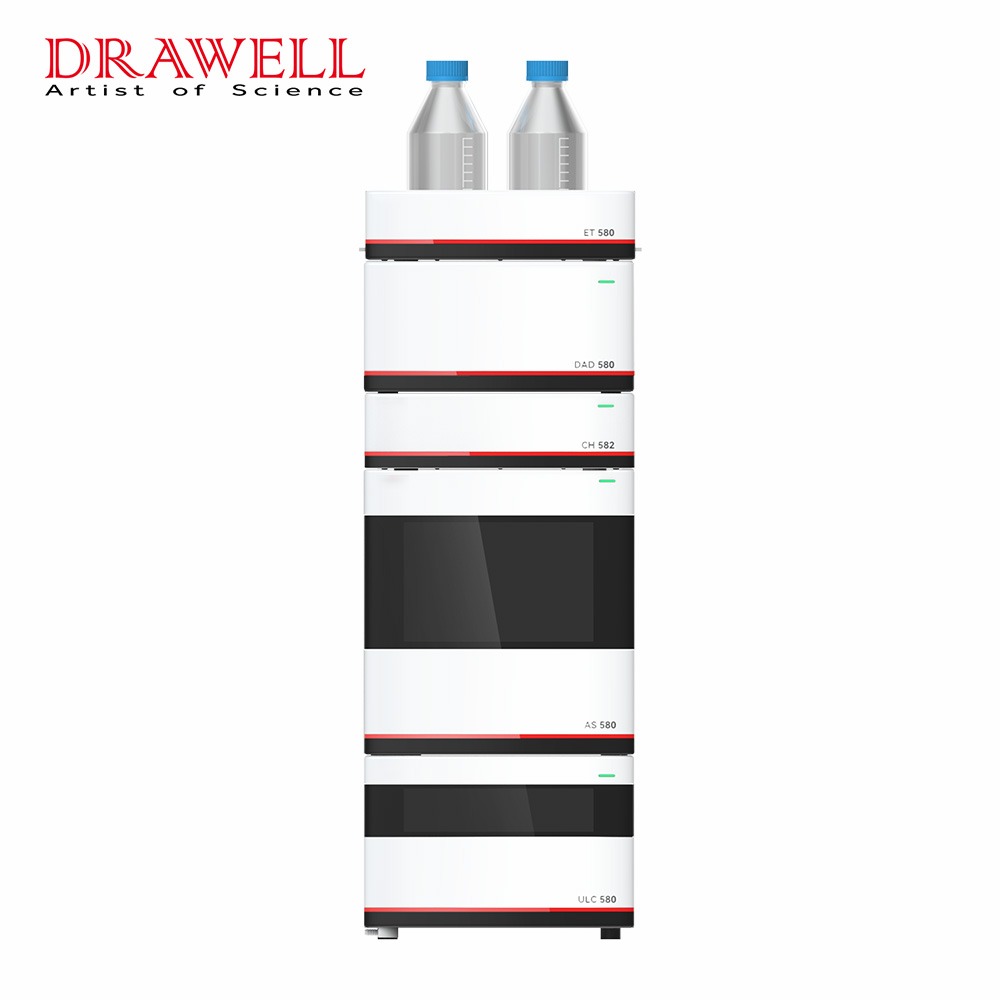
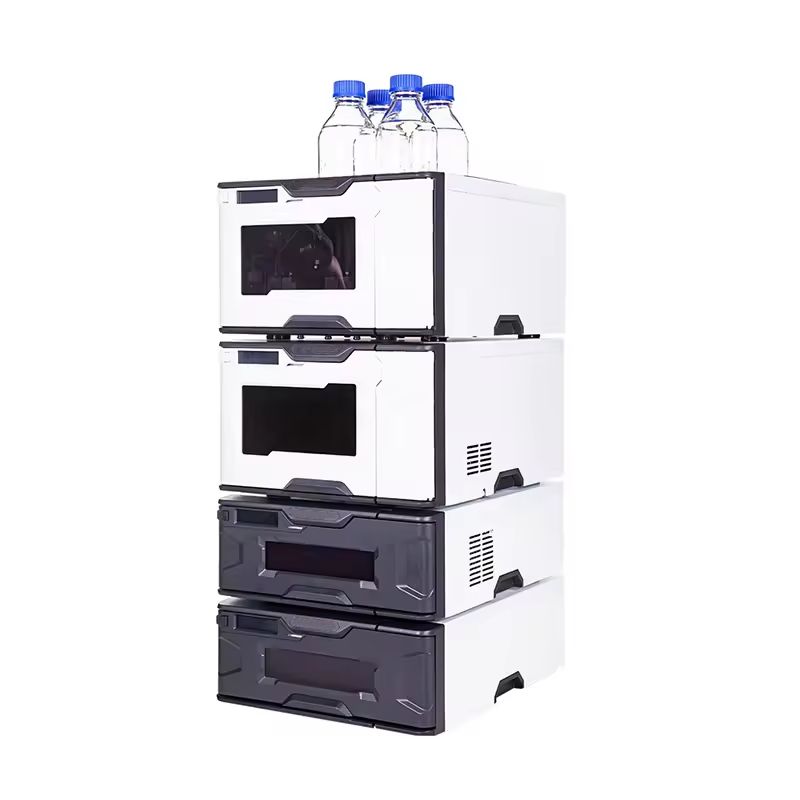
Advantageous Scenarios of HPLC:
Suitable for analyzing formaldehyde in aqueous solutions, such as wastewater, biological fluids, and food products.
Applications include water quality monitoring, food safety analysis, and pharmaceutical analysis. For example, analyzing formaldehyde levels in fish samples using HPLC-UV after DNPH derivatization to ensure food safety compliance.
The choice between GC and HPLC hinges on the sample matrix and the analyte’s physical properties. GC is preferred for gaseous samples, while HPLC is the go-to method for liquid samples, particularly those containing non-volatile or thermally sensitive formaldehyde.
Data Verification Indicators for GC and HPLC
When verifying data from GC and HPLC analyses, several key indicators are used to ensure the reliability and accuracy of the results. Here’s a breakdown of those parameters, along with typical values:
| Indicator | Typical Values/Acceptance Criteria | Description |
| Retention Time | Consistent with standards. Variability: RSD ≤ 2% | Time it takes for a compound to elute from the column. Used for identification. |
| Peak Area/Height | Linear response with concentration. Used for quantification. | Measure of the detector response, proportional to the analyte concentration. |
| Calibration Curve Linearity | Correlation coefficient (R²) ≥ 0.99 | Linear relationship between analyte concentration and detector response. |
| Limit of Detection (LOD) | Lowest concentration detectable. Varies widely depending on the analyte and detector. | The lowest concentration of an analyte that can be detected but not necessarily quantified. |
| Limit of Quantification (LOQ) | Lowest concentration quantifiable. Typically, 3-10 times the LOD. | The lowest concentration of an analyte that can be reliably quantified. |
| Recovery Rate | Typically 80-120%, but can vary. Depends on the matrix and analyte. | Percentage of the analyte recovered during sample preparation and analysis. |
| Precision (RSD) | Relative standard deviation (RSD) ≤ 2-5% for most analyses. | Measure of the reproducibility of the analysis. |
| Accuracy | Bias within acceptable limits (e.g., ± 10%). | Measure of how close the measured value is to the true value. |
Important Considerations:
- RSD (Relative Standard Deviation): This measures the precision of the method. Lower RSD values indicate better reproducibility.
- Calibration Curve: A well-constructed calibration curve is essential for accurate quantification. Linearity is crucial.
- LOD and LOQ: These parameters define the sensitivity of the method. They are critical for trace analysis.
- Recovery: Recovery studies are vital for assessing the accuracy of sample preparation procedures.
- System Suitability Tests (SST): Especially in HPLC, SSTs are performed to ensure the system’s performance is adequate for the analysis. This can include assessments of resolution, tailing factors, and column efficiency.
By carefully evaluating these indicators, analysts can ensure the reliability and validity of their GC and HPLC results.
Related Products
Get Quote Here!
Latest Posts

What Next?
For more information, or to arrange an equipment demonstration, please visit our dedicated Product Homepage or contact one of our Product Managers.