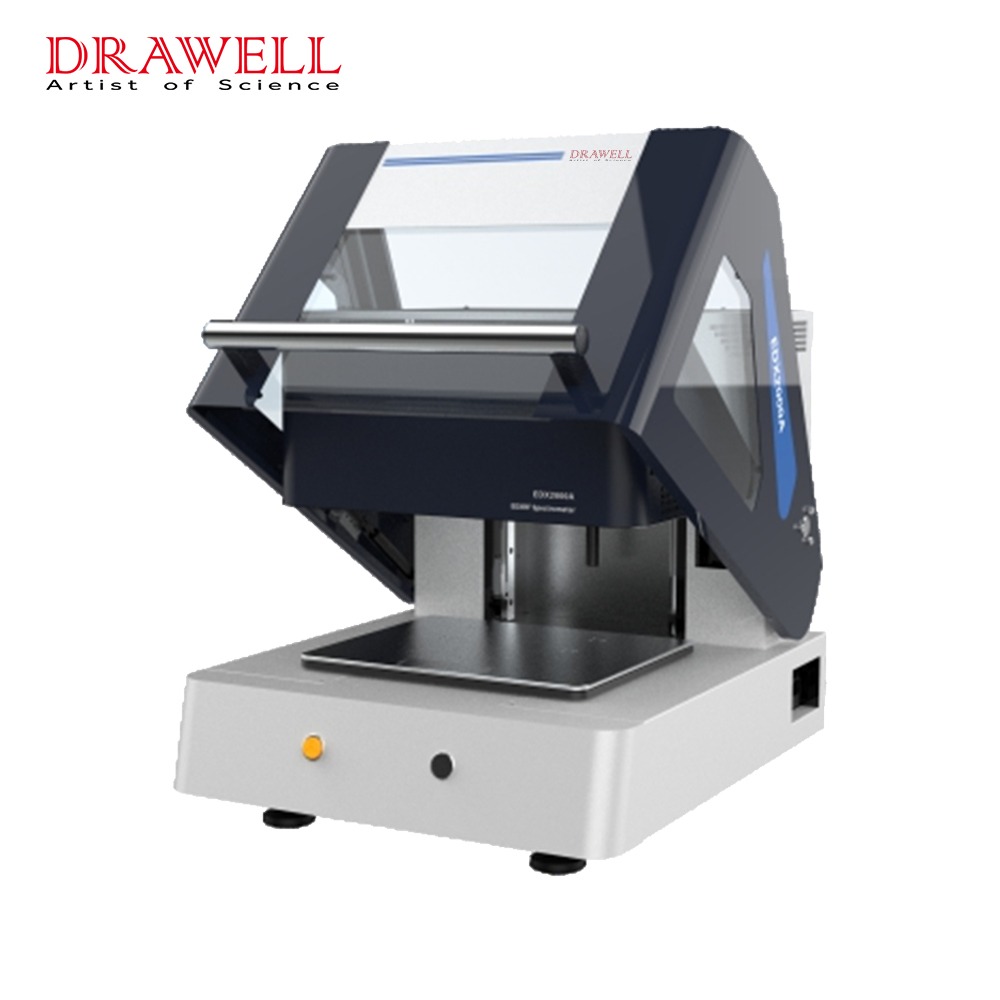
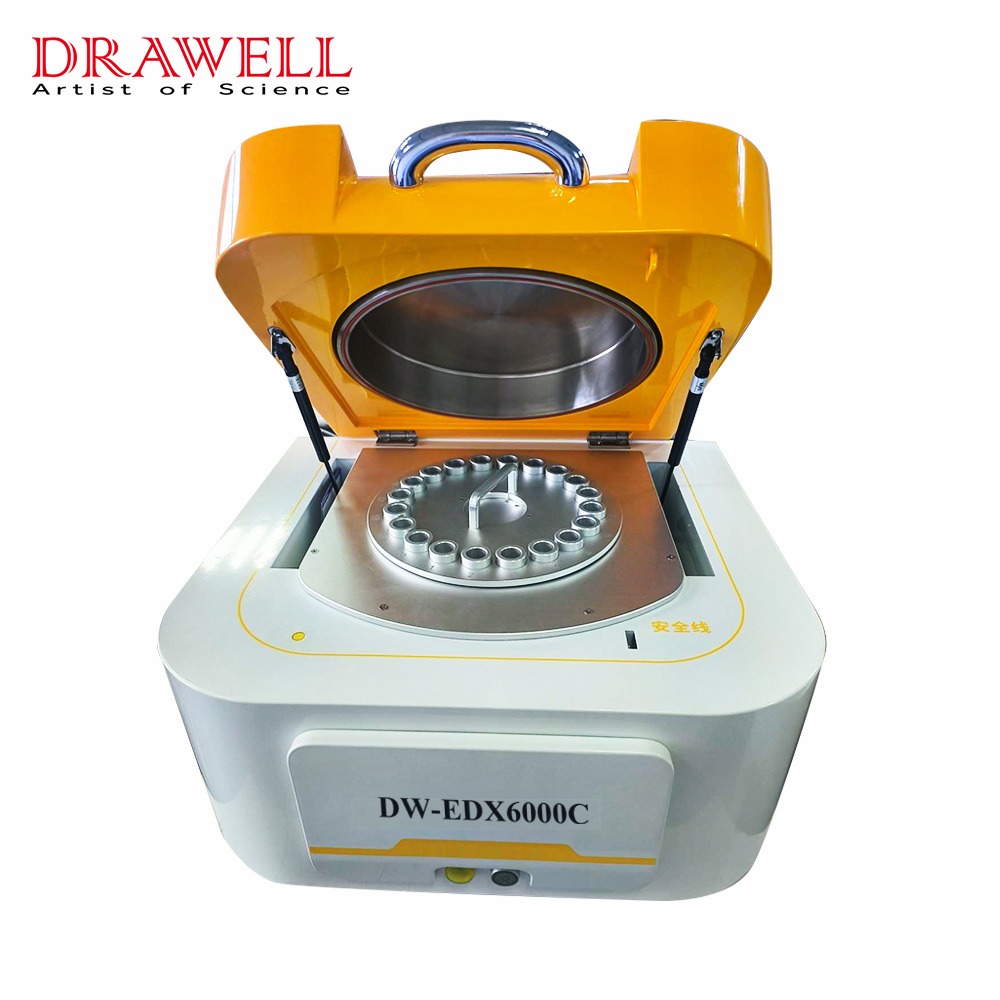
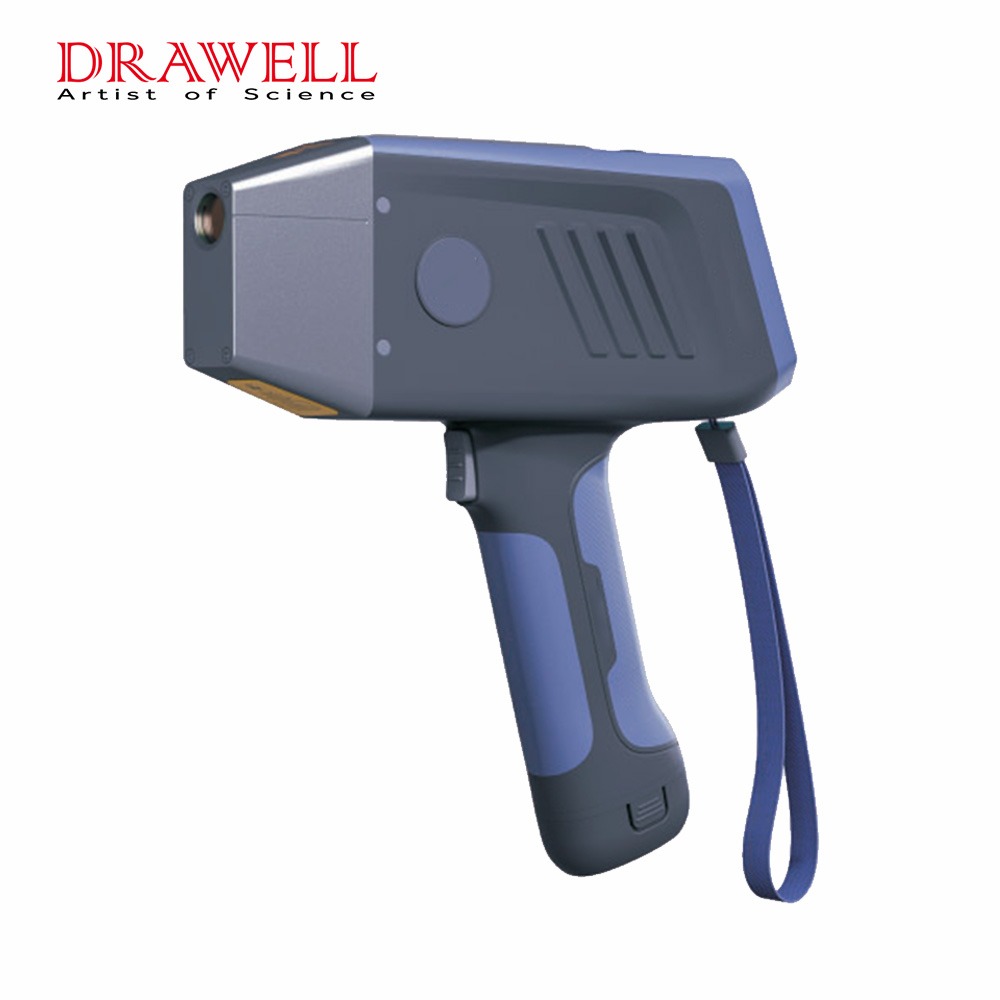
When the sample is irradiated with X-rays, the sample can be excited to emit fluorescent X-rays of various wavelengths. It is necessary to separate the mixed X-rays by wavelength (or energy) and measure the intensity of X-rays of different wavelengths (or energies). Carry out qualitative and quantitative analysis, the instrument used for this purpose is called an X-ray fluorescence spectrometer.
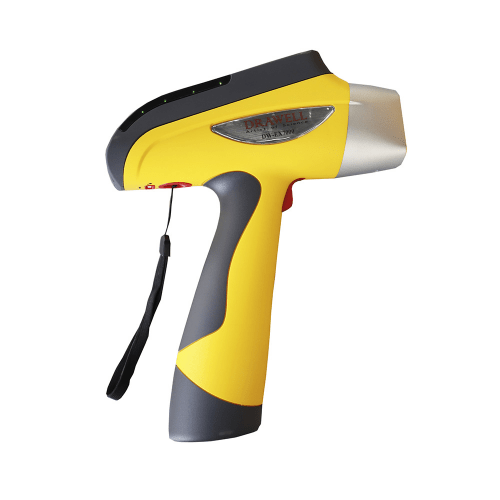
XRF analysis is a mature technology that uses primary X-ray photons or other microscopic ions to excite atoms in the substance to be tested to generate fluorescence (secondary X-rays) for material composition analysis and chemical state research. Used to verify composition industry-wide, it is a fast, non-destructive method of substance measurement. When determining whether there are restricted substances in electronic and electrical products, XRF is generally used for primary screening. Its fundamentally non-destructive nature, combined with advantages such as fast measurement and compact bench-top instrumentation, enables on-site analysis and immediate results.
Classification of an X-ray fluorescence spectrometer
As a comparative analysis technique, an X-ray fluorescence spectrometer (XRF) uses primary X-ray photons or other microscopic particles to excite atoms in the substance to be measured under certain conditions, causing them to generate fluorescence (secondary X-rays) to conduct material analysis. According to different excitation, dispersion, and detection methods, it can be divided into X-ray Spectroscopy (Wavelength Dispersion) and X-ray spectroscopy (energy dispersive).
Principle of an X-ray fluorescence spectrometer
The primary X-ray emitted by the X-ray light tube is injected into the sample to excite the characteristic lines of each element in the sample. The detector records X-ray photons N of characteristic wavelengths. According to the intensity of X-ray photon N of a specific wavelength, the element concentration corresponding to the wavelength is calculated.
Features and applications of an X-ray fluorescence spectrometer
1. Advantages:
The equipment is relatively simple.
It can work in the atmosphere and has high sensitivity.
2. Disadvantages:
The incident depth of X-rays is relatively large, so when the thickness of the film is below the micron level, conventional ray technology has no advantage in determining the structure and composition information of the film.
3. Applications:
The X-ray fluorescence analysis technology driven by the continuous improvement and development of the X-ray fluorescence spectrometer has been widely used in many departments and fields such as metallurgy, geology, minerals, petroleum, chemical industry, biology, medical treatment, criminal investigation, and archaeology. X-ray fluorescence spectroscopic analysis is not only a test for the chemical elements, phases, chemical three-dimensional structure, and evidence materials of its substances, but also a non-destructive test for product and material quality, medical examination for the human body, and photolithographic inspection of microcircuits. It is an important analysis method, and it is also a fast, accurate, and economical multi-element analysis method commonly used in material science, life science, and environmental science. At the same time, an X-ray fluorescence spectrometer is also one of the preferred instruments for field analysis and process control analysis.
Sample Preparation and Analysis of XRF
1. Sample preparation
The sample for X-ray fluorescence spectroscopic analysis can be a solid or aqueous solution. Regardless of the sample, the conditions of sample preparation have a great influence on the measurement error. In short, the measured sample cannot contain water, oil, and volatile components, let alone corrosive solvents.
2. Analysis of XRF
Here are two analyses of XRF. The first is qualitative analysis.
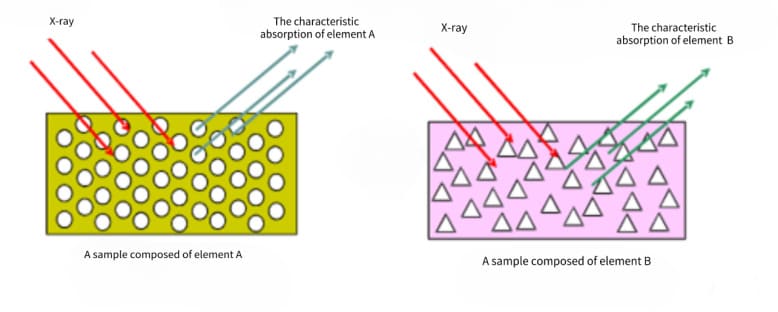
The fluorescent X-rays of different elements have their specific wavelengths, so the composition of the elements can be determined according to the wavelength of the fluorescent X-rays. However, if the element content is too low or there is spectral line interference between elements, manual identification is required. When analyzing unknown spectral lines, factors such as the source and nature of the sample need to be considered to make a comprehensive judgment.
The second is quantitative analysis.
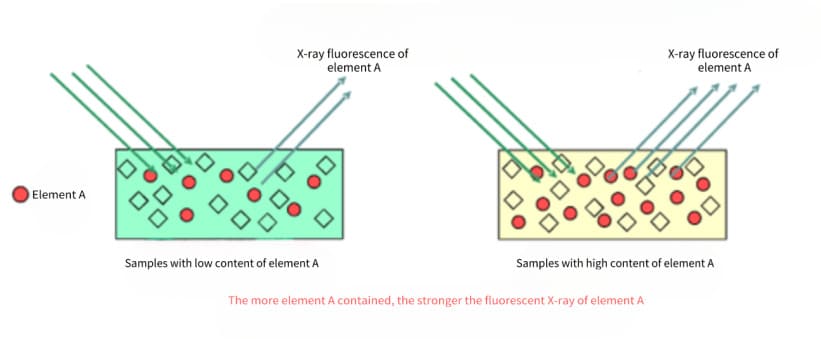
The basis for quantitative analysis by X-ray fluorescence spectrometry is that the fluorescent X-ray intensity Ii of an element is proportional to the content Wi in the sample:
Ii=IsWi
In the formula, Is is the fluorescent X-ray intensity of the element when Wi=100%. According to the above formula, the standard curve method, incremental method, internal standard method, etc. can be used for quantitative analysis. However, these methods must make the composition of the standard sample and the sample as identical or similar as possible, otherwise, the matrix effect of the sample or the influence of coexisting elements will cause great deviations in the measurement results.

